Normative Comparisons in Diagnosing Autism Spectrum Disorder
Autism Spectrum Disorder (ASD) is a neurodevelopmental disorder characterized by deficits in social communication and social interactions and accompanied by restricted, repetitive patterns of behavior, interests, or activities (American Psychiatric Association, 2022). The degree to which these symptoms manifest can vary considerably across different individuals and can even differ among contexts for the same individual.
Since symptoms of autism differ from person to person, diagnosis can be challenging. Assessments designed to identify symptoms and behaviors associated with ASD can be particularly beneficial to clinicians. Scientifically developed assessments can help yield accurate and informative data, leading to better decision-making and treatment planning (Naglieri & Goldstein, 2013). Using reliable and validated tools to help with the diagnosis process is critical.
Commonly, assessments of ASD compare an individual to a normative sample of other individuals with ASD. The purpose of a normative sample is to create a reference group to which scores can be compared, so an individual’s score can be understood relative to what is “normal” or typical of a larger population. There are limitations to comparing one diagnosis to another due to the fact that ASD is a spectrum rather than a conditional diagnosis. When a normative sample comprises of individuals diagnosed with ASD, the deviation from what is “typical” may be hard to spot and lead to some individuals not showing elevated scores.
What is the Autism Spectrum Rating Scales and how does it work?
MHS’ Autism Spectrum Rating Scales™ (ASRS®; Goldstein & Naglieri, 2009) was designed to measure symptoms and behaviors associated with ASD in children aged 2 to 5 and youth aged 6 to 18 through ratings from parents and/or teachers. The ASRS uses a 5-point frequency scale to indicate how often a child is observed displaying specific actions in several areas, including, but not limited to, social/communication, unusual behavior, and self-regulation. The raw ratings are then converted to standardized scores (T-scores) derived from a normative group of children the same age as the rated child.
While many assessments of ASD exist, the ASRS is unique in its method of deriving normative reference scores. The ASRS provides the first nationally standardized, norm-referenced ASD rating scale with a parent and teacher sample of 2,560 children and youth from across the United States. The normative samples closely match the U.S. population in age, gender, race/ethnicity, parental educational level (for parent raters) and geographic region. The ASRS normative sample also matches varying clinical diagnoses (4.4% of ASRS [2–5 Years] and 8.7% of the ASRS [6–18 Years] had a clinical diagnosis, in line with reported youth prevalence rates). While competing assessments use a normative sample that compares the scores of the rated individual to others with ASD, the ASRS instead uses a normative sample that compares the scores of the rated individual to those from the general population.
How can the difference between nationally representative samples and clinical samples affect diagnoses?
Although a general population normative sample is less commonly used for assessments of ASD, research has investigated the utility of this approach. Naglieri (2013) examined the differences in T-scores obtained when using a nationally representative sample versus a clinical sample of children with ASD as a reference group. The nationally representative sample T-scores yielded higher overall standard scores, and the ASD clinical sample yielded lower standard scores.
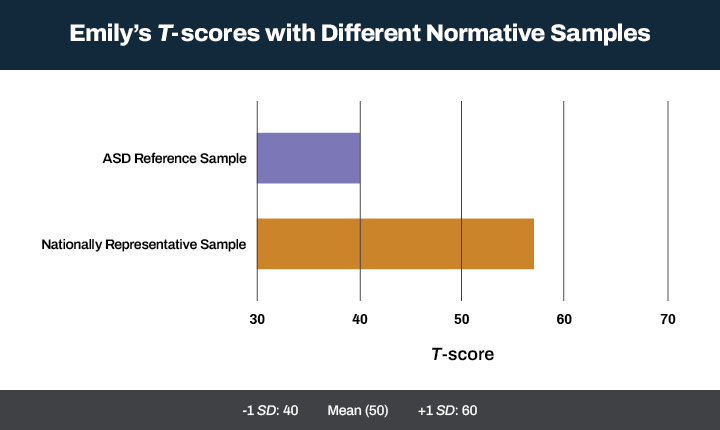
Consider Emily, a 6-year-old who obtained an overall raw score of 80. When compared against a nationally representative sample, this raw score yields a T-score of 57 (nearly 1 standard deviation above the mean). However, compared to an ASD reference group, the same raw score yields a T-score of 40 (1 standard deviation below the mean). These results demonstrate that the same score on a rating scale can lead to two distinct conclusions when compared against different samples (Naglieri, 2013). In this example, a T-score of 40 relative to others with ASD might lead a clinician to conclude that Emily’s symptoms are less frequent or severe than her peers, which in turn will guide the diagnostic and treatment decisions. On the other hand, if Emily has an elevated T-score of 57 relative to peers in the general population, this result might lead the clinician down a separate path that may require different diagnostic and treatment decisions.
Figure 1: Emily’s T-scores compared against different normative samples

MHS is committed to creating products that make a difference in the lives of families and children living with ASD. The ASRS demonstrates strong reliability and validity and can be used to evaluate individuals exhibiting symptoms and behaviors associated with ASD. The ASRS uses a normative sample comprising a group resembling the general population, providing a more informative score that can be easily interpreted relative to “typical” functioning same-age peers. This approach allows clinicians to arrive at more precise conclusions which allows them to make informed recommendations specific to the individual, leading to better outcomes. Since its publication in 2009, the ASRS has been chosen as a trusted tool by clinicians, therapists, and psychologists to help with diagnostic evaluations, treatment planning or assessing treatment effectiveness from interventions.
Learn more about MHS’ Autism Spectrum Rating Scales.
References
American Psychiatric Association. (2022). Diagnostic and statistical manual of mental disorders: Fifth edition text revision (DSM-5-TR™). American Psychiatric Association Publishing.
Goldstein, S., & Naglieri, J. A. (2009). Autism spectrum rating scales (ASRS) [technical manual]. Multi-Health Systems.
Naglieri, J. A., & Goldstein, S. (2013). Evaluation of treatment effectiveness in the field of Autism: Psychometric considerations and an illustration. In S. Goldstein & J. A. Naglieri (Eds.),
Interventions for Autism Spectrum Disorders: Translating Science into Practice (pp. 39-55).
Springer.
Naglieri, J. A. (2013). Psychological assessment by school psychologists: Opportunities and challenges of a changing landscape. In K. F. Geisinger, B. A. Bracken, J. F. Carlson, J.-I. C. Hansen, N. R. Kuncel,
S. P. Reise, & M. C. Rodriguez (Eds.), APA handbook of testing and assessment in psychology,
Vol. 3. Testing and assessment in school psychology and education (pp. 3–19). American
Psychological Association.


Leave a Reply